| Ⅰ | This article along with all titles and tags are the original content of AppNee. All rights reserved. To repost or reproduce, you must add an explicit footnote along with the URL to this article! |
| Ⅱ | Any manual or automated whole-website collecting/crawling behaviors are strictly prohibited. |
| Ⅲ | Any resources shared on AppNee are limited to personal study and research only, any form of commercial behaviors are strictly prohibited. Otherwise, you may receive a variety of copyright complaints and have to deal with them by yourself. |
| Ⅳ | Before using (especially downloading) any resources shared by AppNee, please first go to read our F.A.Q. page more or less. Otherwise, please bear all the consequences by yourself. |
| This work is licensed under a Creative Commons Attribution-NonCommercial-ShareAlike 4.0 International License. |
Compared with the powerful SpeQ, Graph is more concentrated. Specially deal with the graph of a function, it covers all features for the evaluation of functions from Elementary Mathematics to Higher Mathematics, as a open-source, free and full-featured function drawing application, as well as a small size, Graph is a recommendable mathematical tool.
To study mathematical function, you can get twofold results with half the effort only if with the number-graphic combination. Graph is a function drawing calculator, it can set up the graph form according to the custom format, and supports printing square or round coordinate chart.
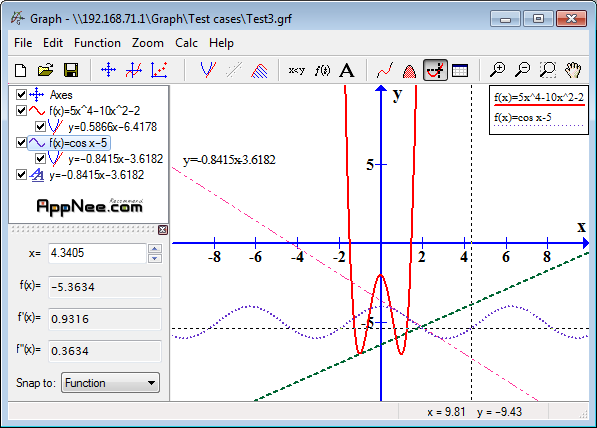
Graph covers a wide range of methods for mathematical function drawing, as long as given function equation, it can immediately make function diagram, besides, you can also draw the tangent and axes, derivation and integral using graphic, or insert a series of points, etc. In addition, the Graph also contains a variety of common templates, including animation, oblique asymptote, tangent, shadow, contour, and so on for improving your solution efficiency.
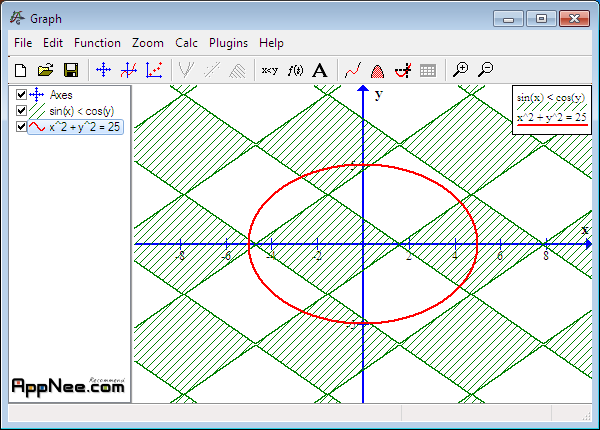
In addition to make general function, parameter function, Graph also supports the inverse function. It provides a large number of built-in functions for you, such as sin, cos, log, etc., and the color, width of the line are all customizable. Moreover, Graph allows to draw a graph in accordance with relational expressions, such as sin (x) < cos (y) or x2 + y2 = 25….
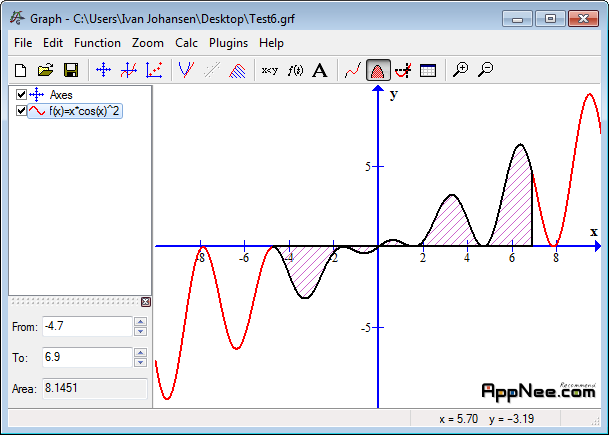
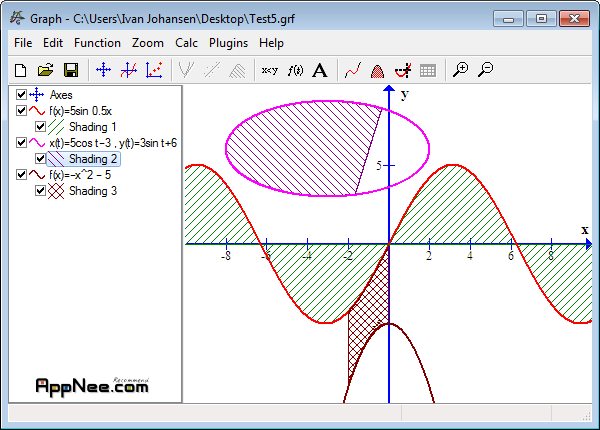
Graph allows users to save the completed coordinate system as image format files, such as BMP, PNG, JPEG, EMF or PDF, so as to import the coordinate system to other project for integration easily, and convenient for team cooperation. Sometimes, in order to integrate to some interval of function more intuitively, we may need distinguish this area with shadow, and Graph enables us to insert a piece of shadow to indicate this interval.
// Key Features //
- Draw functions
- Draw relation
- Shadings
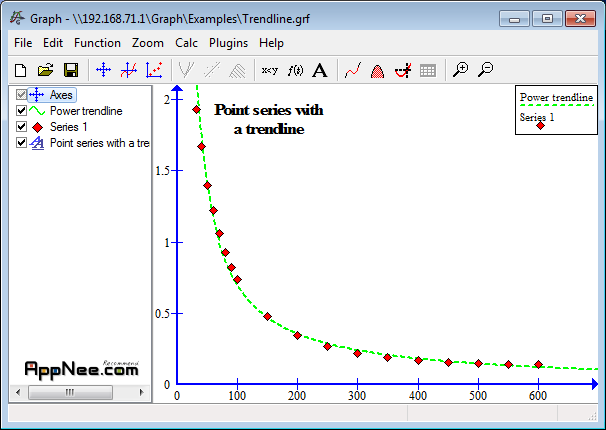
- Point series and trendlines
- Differentiation and tangents
- Interact with other programs
- Evaluate
- Tables
- Area and length of path
- Text labels
- Custom functions
- Animation
// Related Links //
// Download URLs //
 (Homepage | SourceForge)
| If some download link is missing, and you do need it, just please send an email (along with post link and missing link) to remind us to reupload the missing file for you. And, give us some time to respond. | |
| If there is a password for an archive, it should be "appnee.com". | |
| Most of the reserved downloads (including the 32-bit version) can be requested to reupload via email. |