Tag Archives: data visualization

[v9.2, v9.1] Splunk – Search, analysis and visualization for actionable insights from all your data

This article along with all titles and tags are the original content of AppNee. All rights reserved. To repost or reproduce, you must add an explicit footnote along with the URL to this article!
Any manual or automated whole-website collecting/crawling behaviors are strictly prohibited.
Any resources shared on AppNee are limited to personal study and research only, any form of commercial behaviors are strictly prohibited. Otherwise, you may receive a variety of copyright complaints and have to deal with them by yourself.
Before using (especially downloading) any resources shared by AppNee, please first go to read our F.A.Q. page more or less. Otherwise, please bear all the consequences by yourself.
This work is licensed under a Creative Commons Attribution-NonCommercial-ShareAlike 4.0 International License.

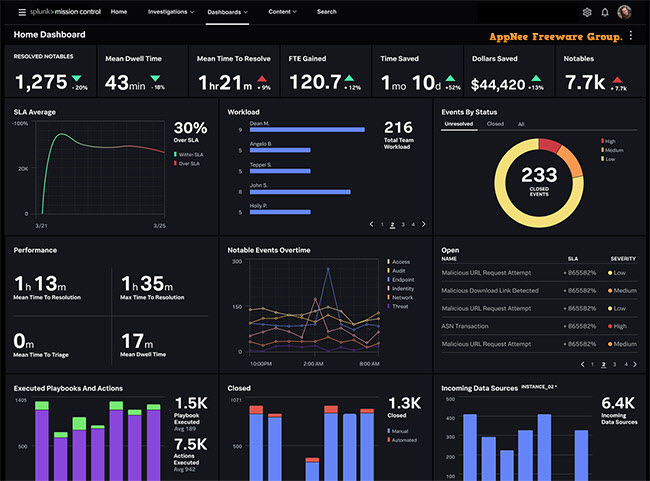
Splunk is a top-level distributed data computing platform for Windows, Mac and Linux platforms. It can process various logs or machine data generated by any system, software or device, and provides operations such as real-time data collection, storage, indexing, searching, correlation, visualization, analysis, and reporting in a wide range of scenarios, so as to transform big data into actions and values of the enterprise.

Continue reading [v9.2, v9.1] Splunk – Search, analysis and visualization for actionable insights from all your data

[v1.33, v1.46] Easy Data Transform – Transform your data into information

We may have to deal with a large amount of CSV, XLXS and other table data in our daily work. However, there are many disadvantages of using traditional CSV editing tools or importing it into database for operations. For example, complex operations cannot be executed through scripts; with low efficiency and high cost; once the operation is wrong, it is very difficult or even impossible to undo the operation; once there is a problem, it is difficult to find out where the problem starts; not WYSIWYG… Hence, that’s where we got this edge tool – Easy Data Transform.

Continue reading [v1.33, v1.46] Easy Data Transform – Transform your data into information

If some download link is missing, and you do need it, just please send an email (along with post link and missing link) to remind us to reupload the missing file for you. And, give us some time to respond.
If there is a password for an archive, it should be "appnee.com".
Most of the reserved downloads (including the 32-bit version) can be requested to reupload via email.

[v2023.1, v10.2] Tableau Desktop – Business analytics that anyone can learn and use

Tableau Desktop is a famous and very powerful data analysis & visualization leader. In addition to professional technology, more importantly, it’s a foolproof tool that can make externalization and visualization process to complex data, so that ordinary users are able to easily show their complex data in hand in a professional way with all sorts of graphs.

Continue reading [v2023.1, v10.2] Tableau Desktop – Business analytics that anyone can learn and use

[v17.0] Stata – Popular statistical software for data science

Stata is an integrated statistical software that integrates data analysis, data management and professional charts drawing features in one place. It is mainly used for data manipulation, visualization, statistics, and automated reporting by researchers in many fields, including biomedicine, economics, epidemiology, and sociology.

Continue reading [v17.0] Stata – Popular statistical software for data science

[v2024.0] Maple – Essential tool for mathematics

Maple is a general-purpose commercial computer algebra system (symbolic computing environment + numeric computing environment + multi-paradigm programming language) developed by Maplesoft (Waterloo Maple) from Canada in 1982. It is known as one of the three major mathematical software programs along with MATLAB and Mathematica, and its main competitor should be Mathematica

Continue reading [v2024.0] Maple – Essential tool for mathematics

[v21.4] Minitab – Powerful statistical software everyone can use

Minitab is the unmatched, all-in-one data analysis and statistics software for everyone that lets data be used for what it is worth. It is not only a leader in providing statistical software and services for quality improvement, education and research applications, but also a world-leading software tool for quality management and Six Sigma implementation, as well as a good tool for continuous quality improvement. It can analyze data to identify problems and meaningful solutions when users encounter the most intractable business problems.

Continue reading [v21.4] Minitab – Powerful statistical software everyone can use

[v7.7] Log Parser Lizard – Best GUI for Microsoft Logparser

The operation and maintenance of websites or web services can’t do without checking and analyzing the server logs. For this, many webmasters or administrators may have the very powerful and professional log analyzing tool from Microsoft – logparser (AKA: Log Parser, Microsoft Logparser) in mind. But Microsoft Logparser’s command line interface can be a daunting challenge for many non-professional managers. Thereupon, some enhanced GUI tools for Microsoft Logparser such like Visual Log Parser GUI, Log Parser Lizard appeared.

Continue reading [v7.7] Log Parser Lizard – Best GUI for Microsoft Logparser