[v21.4] Minitab – Powerful statistical software everyone can use

This article along with all titles and tags are the original content of AppNee. All rights reserved. To repost or reproduce, you must add an explicit footnote along with the URL to this article!
Any manual or automated whole-website collecting/crawling behaviors are strictly prohibited.
Any resources shared on AppNee are limited to personal study and research only, any form of commercial behaviors are strictly prohibited. Otherwise, you may receive a variety of copyright complaints and have to deal with them by yourself.
Before using (especially downloading) any resources shared by AppNee, please first go to read our F.A.Q. page more or less. Otherwise, please bear all the consequences by yourself.
This work is licensed under a Creative Commons Attribution-NonCommercial-ShareAlike 4.0 International License.

Minitab is the unmatched, all-in-one data analysis and statistics software for everyone that lets data be used for what it is worth. It is not only a leader in providing statistical software and services for quality improvement, education and research applications, but also a world-leading software tool for quality management and Six Sigma implementation, as well as a good tool for continuous quality improvement. It can analyze data to identify problems and meaningful solutions when users encounter the most intractable business problems.

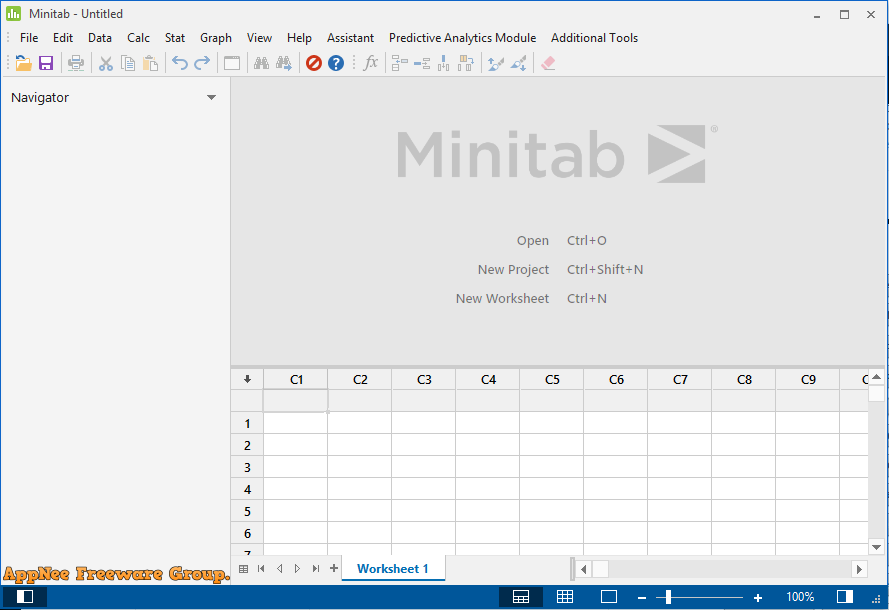
Minitab mainly provides statistical analysis, visualization analysis, prediction analysis and improvement analysis to support data-driven decisions; can analyze data sets of various sizes through a simplified user interface and powerful features; can easily synthesize larger volumes of data; can guide users through the entire analysis; can even help you display and explain the results. In addition, it also supports scatter chart, bubble chart, box chart, dot chart, column diagram, table chart, time series chart, and other visual graphics outputs, and when the data changes, the graph can be updated seamlessly.

As a leader in the field of modern quality management and statistics, and the common language of the global Six Sigma implementation, Minitab is favored by mass quality scholars and statistics experts around the world for its incomparable powerful functions and simple and visualized operation. Since it was founded in the Pennsylvania State University in United States in 1972, it has been widely used in more than 100 countries, more than 4800 universities (its customers include the world’s leading enterprises and academies), and has been cited in more than 500 textbooks.

Minitab is so easy to use that it requires almost no specialized learning and training for users at any level. Instead, it takes us just a few minutes to get started. This is one of its irreplaceable advantages! In summary, Minitab can help us analyze larger data sets faster, better, more accurately, and more easily.
// Key Features //

Feature Description
Assistant
  • Measurement systems analysis
  • Capability analysis
  • Graphical analysis
  • Hypothesis tests
  • Regression
  • DOE
  • Control charts
Graphics
  • Binned scatterplots, boxplots, charts, correlograms, dotplots, heatmaps, histograms, matrix plots, parallel plots, scatterplots, time series plots, etc.
  • Contour and rotating 3D plots
  • Probability and probability distribution plots
  • Automatically update graphs as data change
  • Brush graphs to explore points of interest
  • Export: TIF, JPEG, PNG, BMP, GIF, EMF
Basic Statistics
  • Descriptive statistics
  • One-sample Z-test, one- and two-sample t-tests, paired t-test
  • One and two proportions tests
  • One- and two-sample Poisson rate tests
  • One and two variances tests
  • Correlation and covariance
  • Normality test
  • Outlier test
  • Poisson goodness-of-fit test
Regression
  • Linear regression
  • Nonlinear regression
  • Binary, ordinal and nominal logistic regression
  • Stability studies
  • Partial least squares
  • Orthogonal regression
  • Poisson regression
  • Plots: residual, factorial, contour, surface, etc.
  • Stepwise: p-value, AICc, and BIC selection criterion
  • Best subsets
  • Response prediction and optimization
  • Validation for Regression and Binary Logistic Regression
Analysis of Variance
  • ANOVA
  • General linear models
  • Mixed models
  • MANOVA
  • Multiple comparisons
  • Response prediction and optimization
  • Test for equal variances
  • Plots: residual, factorial, contour, surface, etc.
  • Analysis of means
Measurement Systems Analysis
  • Data collection worksheets
  • Gage R&R Crossed
  • Gage R&R Nested
  • Gage R&R Expanded
  • Gage run chart
  • Gage linearity and bias
  • Type 1 Gage Study
  • Attribute Gage Study
  • Attribute agreement analysis
Quality Tools
  • Run chart
  • Pareto chart
  • Cause-and-effect diagram
  • Variables control charts: XBar, R, S, XBar-R, XBar-S, I, MR, I-MR, I-MR-R/S, zone, Z-MR
  • Attributes control charts: P, NP, C, U, Laney P’ and U’
  • Time-weighted control charts: MA, EWMA, CUSUM
  • Multivariate control charts: T2, generalized variance, MEWMA
  • Rare events charts: G and T
  • Historical/shift-in-process charts
  • Box-Cox and Johnson transformations
  • Individual distribution identification
  • Process capability: normal, non-normal, attribute, batch
  • Process Capability SixpackTM
  • Tolerance intervals
  • Acceptance sampling and OC curves
  • Multi-Vari chart
  • Variability chart
Design of Experiments
  • Definitive screening designs
  • Plackett-Burman designs
  • Two-level factorial designs
  • Split-plot designs
  • General factorial designs
  • Response surface designs
  • Mixture designs
  • D-optimal and distance-based designs
  • Taguchi designs
  • User-specified designs
  • Analyze binary responses
  • Analyze variability for factorial designs
  • Botched runs
  • Effects plots: normal, half-normal, Pareto
  • Response prediction and optimization
  • Plots: residual, main effects, interaction, cube, contour, surface, wireframe
Reliability/Survival
  • Parametric and nonparametric distribution analysis
  • Goodness-of-fit measures
  • Exact failure, right-, left-, and interval-censored data
  • Accelerated life testing
  • Regression with life data
  • Test plans
  • Threshold parameter distributions
  • Repairable systems
  • Multiple failure modes
  • Probit analysis
  • Weibayes analysis
  • Plots: distribution, probability, hazard, survival
  • Warranty analysis
Power and Sample Size
  • Sample size for estimation
  • Sample size for tolerance intervals
  • One-sample Z, one- and two-sample t
  • Paired t
  • One and two proportions
  • One- and two-sample Poisson rates
  • One and two variances
  • Equivalence tests
  • One-Way ANOVA
  • Two-level, Plackett-Burman and general full factorial designs
  • Power curves
Predictive Analytics
  • CART Classification
  • CART Regression
  • Random Forests Classification
  • Random Forests Regression
  • TreeNet Classification
  • TreeNet Regression
Multivariate
  • Principal components analysis
  • Factor analysis
  • Discriminant analysis
  • Cluster analysis
  • Correspondence analysis
  • Item analysis and Cronbach’s alpha
Time Series and Forecasting
  • Time series plots
  • Trend analysis
  • Decomposition
  • Moving average
  • Exponential smoothing
  • Winters’ method
  • Auto-, partial auto-, and cross correlation functions
  • ARIMA
Nonparametrics
  • Sign test
  • Wilcoxon test
  • Mann-Whitney test
  • Kruskal-Wallis test
  • Mood’s median test
  • Friedman test
  • Runs test
Equivalence Tests
  • One- and two-sample, paired
  • 2×2 crossover design
Tables
  • Chi-square, Fisher’s exact, and other tests
  • Chi-square goodness-of-fit test
  • Tally and cross tabulation
Simulations and Distributions
  • Random number generator
  • Probability density, cumulative distribution, and inverse cumulative distribution functions
  • Random sampling
  • Bootstrapping and randomization tests
Macros and Customization
  • Customizable menus and toolbars
  • Extensive preferences and user profiles
  • Powerful scripting capabilities
  • Python integration
  • R integration

// Official Demo Video //

// System Requirements //

  • Microsoft Visual C++ 2015-2019 Redistributable Packages

// Edition Statement //

AppNee provides the Minitab multilingual full installers and unlocked files, as well as pre-activated full installers for Windows 64-bit only.

// Installation Notes //

for v20.3.0+ on Windows:

  1. Download and install Minitab as trial
  2. Copy the unlocked files to installation folder and overwrite
  3. Done

*** You may need to block this program with your firewall.

// Related Links //

// Download URLs //

Version Download Size
for Windows
v21.4.0 266 MB

(Homepage)

If some download link is missing, and you do need it, just please send an email (along with post link and missing link) to remind us to reupload the missing file for you. And, give us some time to respond.
If there is a password for an archive, it should be "appnee.com".
Most of the reserved downloads (including the 32-bit version) can be requested to reupload via email.