| Ⅰ | This article along with all titles and tags are the original content of AppNee. All rights reserved. To repost or reproduce, you must add an explicit footnote along with the URL to this article! |
| Ⅱ | Any manual or automated whole-website collecting/crawling behaviors are strictly prohibited. |
| Ⅲ | Any resources shared on AppNee are limited to personal study and research only, any form of commercial behaviors are strictly prohibited. Otherwise, you may receive a variety of copyright complaints and have to deal with them by yourself. |
| Ⅳ | Before using (especially downloading) any resources shared by AppNee, please first go to read our F.A.Q. page more or less. Otherwise, please bear all the consequences by yourself. |
| This work is licensed under a Creative Commons Attribution-NonCommercial-ShareAlike 4.0 International License. |
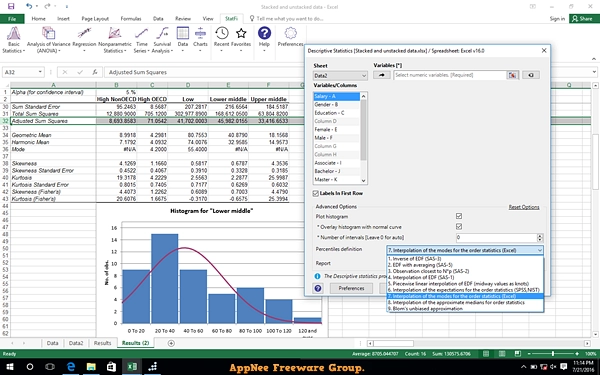
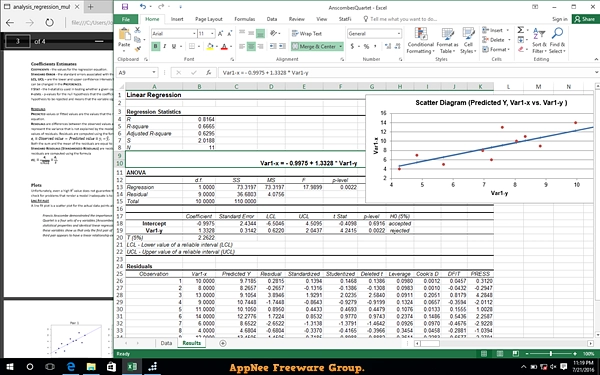
StatPlus (formerly called BioStat) is a robust set of statistical tools, complemented by visually appealing graphical data analysis methods. It turns raw numbers into meaningful insights. Even if you are a beginner and the world of statistics seems incomprehensible to you, this program is designed to be convenient and understandable.
One of the distinctive features of StatPlus is its tight integration with Excel using the StatFi add-on. If you’re familiar with Excel, you’re in luck – this means you can use a familiar environment while gaining advanced statistical capabilities. No more need to switch from one tool to another. It not only analyzes data, but also helps prepare it. You can easily convert and sample data, creating the basis for accurate and meaningful analysis. From regression analysis to nonparametric methods and even survival analysis, StatPlus is like an all-in-one tool for data analysts. No matter what industry you work in, this tool meets a wide range of needs.
If you work in healthcare, finance, education, or any other industry that requires data interpretation, StatPlus will be helpful. To work with it, you don’t need to be a specialist in statistics. Thanks to its user-friendly interface and easy integration with such a well-known platform as Excel, even a novice user can figure it out.
In short, StatPlus features ease of use, integration with Excel, and a large set of tools for from data sampling to advanced statistical analysis. So, if you are still looking for a universal solution that will allow you to speed up the process of data analysis and not get confused in the intricacies of statistics, then StatPlus will help you.
// Key Features //
| Feature | Description |
| Pro Features |
|
| Basic Statistics |
|
| Analysis of Variance (ANOVA) |
|
| Multivariate Analysis |
|
| Nonparametric Statistics |
|
| Regression Analysis |
|
| Time Series Analysis |
|
| Survival Analysis |
|
| Data Processing |
|
| Statistical Charts |
|
// System Requirements //
// Edition Statement //
AppNee provides the StatPlus Pro Edition multilingual full installers and unlocked files for Windows 32-bit and 64-bit.
// Installation Notes //
for v7.7.0 on Windows:
- Download and install StatPlus
- Copy the unlocked file to installation folder and overwrite:
- C:\Users\[user name]\AppData\Roaming\StatPlus6\
- Done
// Download URLs //
| License | Version | Download | Size |
| for Windows | |||
| Pro Edition | v7.7.0 |  |
96.0 MB |
(Homepage)
| If some download link is missing, and you do need it, just please send an email (along with post link and missing link) to remind us to reupload the missing file for you. And, give us some time to respond. | |
| If there is a password for an archive, it should be "appnee.com". | |
| Most of the reserved downloads (including the 32-bit version) can be requested to reupload via email. |