| Ⅰ | This article along with all titles and tags are the original content of AppNee. All rights reserved. To repost or reproduce, you must add an explicit footnote along with the URL to this article! |
| Ⅱ | Any manual or automated whole-website collecting/crawling behaviors are strictly prohibited. |
| Ⅲ | Any resources shared on AppNee are limited to personal study and research only, any form of commercial behaviors are strictly prohibited. Otherwise, you may receive a variety of copyright complaints and have to deal with them by yourself. |
| Ⅳ | Before using (especially downloading) any resources shared by AppNee, please first go to read our F.A.Q. page more or less. Otherwise, please bear all the consequences by yourself. |
| This work is licensed under a Creative Commons Attribution-NonCommercial-ShareAlike 4.0 International License. |
JProfiler is an advanced tool designed for Java developers to dynamically analyze the performance and memory usage of Java applications with the aim of enhancing performance, developed by ej-technologies from Germany. It claims to be the industry’s most comprehensive all-in one Java profiler that helps resolve performance bottlenecks, pin down memory leaks and understand threading issues.
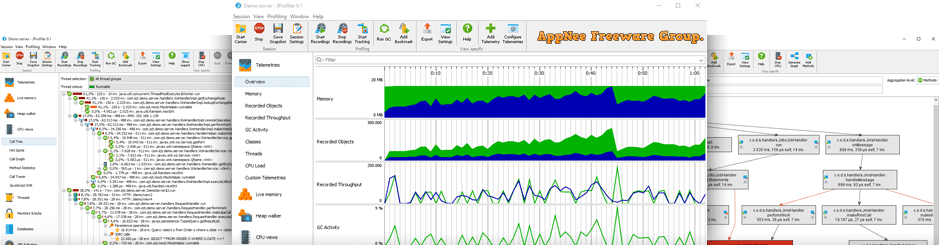
As a comprehensive profiling solution, JProfiler provides deep insights into CPU usage, memory allocation, thread activity, and more, enabling developers to identify bottlenecks and optimize the performance of their applications. With intuitive interface, it offers a variety of profiling modes, including CPU profiling, memory profiling, and thread profiling, allowing users to capture detailed snapshots of their application’s behavior during runtime.
JProfiler is able to seamlessly integrate with popular IDEs like IntelliJ IDEA, Eclipse, and Apache NetBeans. This integration allows developers to start profiling with just a few clicks, making it accessible even to those new to performance tuning. It also supports remote profiling, which is essential for monitoring applications running on servers or cloud environments. By connecting to a remote JVM, developers can gain insights into the application’s performance in a production-like setting without compromising its stability.
Additionally, JProfiler includes advanced features such as leak detection, which helps identify objects that are not being properly garbage-collected, thereby preventing memory leaks. Besides, its intuitive visualizations and detailed reports help developers understand complex data quickly, facilitating informed decision-making regarding code optimization.
In conclusion, JProfiler serves as an invaluable tool for creating detailed profiles of Java applications. Whether it’s fine-tuning methods for faster execution or managing memory usage more effectively, JProfiler serves as an invaluable asset in a developer’s toolkit, helping to deliver high-performance Java applications.
// Key Features //
| Feature | Description |
| Deep insight into JDBC and JPA | Databases calls are a top source for performance problems. JProfiler is the tool that helps you to find and fix them in record time. |
| Built-in support for Kubernetes and Docker | Profiling JVMs in Kubernetes and Docker is hard. With JProfiler, you simply select them in the JProfiler UI. |
| Zero-configuration remote profiling | With JProfiler, you just need SSH credentials for a remote machine to profile a JVM that is running on it. No remote installation required. |
| Advanced profiling of HTTP calls | JProfiler is the expert tool for analyzing HTTP performance problems. Incoming calls, outgoing calls – JProfiler can even track calls across multiple JVMs. |
| Excellent support for Spring & JEE | JProfiler understands Spring and JEE components and combines their high-level information with the low-level information of method calls. |
| MongoDB performance analysis | One of JProfiler’s many high-level probes measures MongoDB calls. You wll solve problems much faster than with simpler profilers that just show method calls. |
| Live profiling data | With JProfiler, you do not have to record all data before you can see it. The UI shows you profiling data as it recorded, wherever it is feasible. |
| Profile from your IDE | JProfiler offers IDE plugins for IntelliJ IDEA, eclipse and Netbeans. Start your profiling sessions with a single click and automatically set the profiled classes to your own code. |
| Integration wizards for application servers | JProfiler has integration wizards for all popular application servers. They modify start scripts or config files as required to load the profiling agent at startup. |
| Offline profiling and triggers | Using a UI for profiling is not required. With offline profiling, you can use JProfiler’s powerful trigger system or the API to record data and save snapshots to disk. |
| Snapshot comparisons | Save and compare snapshots to find out how performance changes between different profiling runs. |
| Use the heap walker to find memory leaks | Finding the causes for memory leaks can be hard. JProfiler makes it easy with the heap walker, the most advanced tool for memory analysis there is. |
| Full support for HPROF/PHD | Native memory snapshots from the hotspot JVM (HPROF) or OpenJ9 (PHD) are read by JProfiler and displayed in the heap walker. |
| Full support for JFR | JFR is an important tool for recording data in production. The full power of JProfiler is available to record and analyze JFR snapshots. |
| Local request tracking | JProfiler lets you follow calls between different threads. Support is available for Executors, virtual threads, AWT, SWT, Kotlin coroutines and more. |
| Remote request tracking | JProfiler can track calls across JVM boundaries, including HTTP requests, RMI, gRPC, web services and remote EJBs. |
| Easily create custom probes | Define custom probes with scripts directly in the UI. For more advanced probes, use the embedded probe API for your own code and the injected probe API for 3rd party code. |
// System Requirements //
- Java Runtime Environment (JRE)
// Universal License Keys //
| For | OS | Name | License Key |
| v10.x | Linux | / |
|
| v14.x | Windows | AppNee Freeware Group. | L-J14-AppNee Freeware Group.#32389-xk8uej3vcuu8t#436b |
// Edition Statement //
AppNee provides the JProfiler multilingual full installers and universal license keys for Windows, as well as pre-activated full installers for Mac and Linux.
// Installation Notes //
for v14.0.4 on Windows:
- Download and install JProfiler
- Run program, select ‘Configure permanent license‘, select ‘License key‘, input the license info (leave “Company” field blank), and click ‘OK‘
- Done
// Related Links //
// Download URLs //
| Version | Download | Size |
| Latest |  |
n/a |
| for Windows | ||
| v14.0.4 |  |
142 MB |
| for Mac | ||
| v13.0 |  |
144 MB |
| for Linux | ||
| v10.1.5 |  |
55.8 MB |
(Homepage)
| If some download link is missing, and you do need it, just please send an email (along with post link and missing link) to remind us to reupload the missing file for you. And, give us some time to respond. | |
| If there is a password for an archive, it should be "appnee.com". | |
| Most of the reserved downloads (including the 32-bit version) can be requested to reupload via email. |