| Ⅰ | This article along with all titles and tags are the original content of AppNee. All rights reserved. To repost or reproduce, you must add an explicit footnote along with the URL to this article! |
| Ⅱ | Any manual or automated whole-website collecting/crawling behaviors are strictly prohibited. |
| Ⅲ | Any resources shared on AppNee are limited to personal study and research only, any form of commercial behaviors are strictly prohibited. Otherwise, you may receive a variety of copyright complaints and have to deal with them by yourself. |
| Ⅳ | Before using (especially downloading) any resources shared by AppNee, please first go to read our F.A.Q. page more or less. Otherwise, please bear all the consequences by yourself. |
| This work is licensed under a Creative Commons Attribution-NonCommercial-ShareAlike 4.0 International License. |
Working with 3D data and creating models or special views can definitely be challenging, often leading users to turn to increasingly complicated software packages. However, there are also more user-friendly options available that maintain essential 3D functionality. One such tool is Voxler, which is designed to efficiently visualize and manage 3D data from various sources and for different purposes.
Voxler is a powerful three-dimensional visualization software solution designed for geoscientists, engineers, and researchers who need to interpret and display complex spatial data. By enabling users to create impressive 3D models from a variety of data sources, including seismic, well log, and other geospatial datasets, it provides an intuitive platform for visualizing subsurface features, aiding in decision-making processes across various industries such as mining, environmental consulting, and oil and gas exploration.
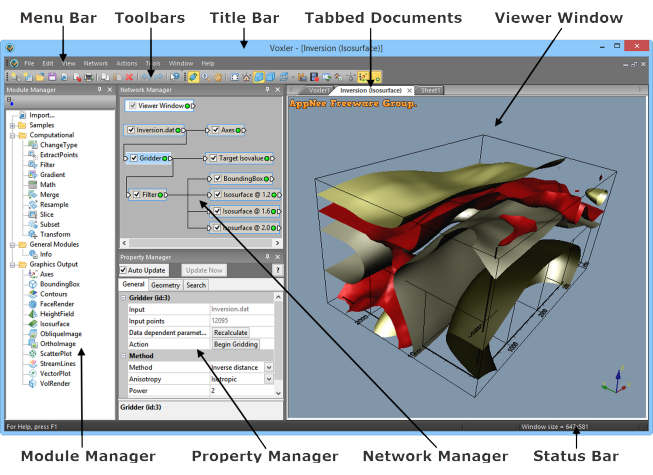
From the outset, Voxler stands out with its thoughtfully designed interface that is likely to appeal to many users. The accessible layout features colorful and intuitive commands and buttons, allowing for easy import of 3D data, and the ability to examine its characteristics in three distinct sections.
Users can view a folder structure that clarifies the origin of their files, while the internal object class hierarchy (including relevant links) can be managed in the Network Manager. Additionally, the main viewer enables users to preview and modify the 3D structure. New objects can be conveniently created using a predefined library for various output types.
Voxler supports importing from numerous popular 3D data formats, including DXF, 3D BLN, SRTM HGT, Adobe PDF vector and raster, JPEG-2000, ERDAS IMG, among others. However, the export options are limited, providing only the common DXF format for 3D files and PNG, TIFF, or GIF for images.
By supporting such a wide range of formats, Voxler significantly enhances interoperability and ensures usability across different 3D software platforms. In addition to its 3D handling capabilities, it also allows users to view associated data such as tables and object class properties.
In short, Voxler offers a robust set of 3D handling tools packaged in an accessible and responsive interface. This makes it an ideal choice for those seeking an efficient method for managing 3D data from diverse sources and generating models and images. With a variety of tools for manipulating 3D objects, as well as their associated object classes or tables, Voxler delivers a comprehensive solution.
// Key Features //
| Feature | Description |
| Voxler Isosurfaces | A Voxler isosurface extends the concept of the contour line (a line of constant data value in two dimensions) to display a surface of constant data value in three dimensions. Combine multiple Isosurfaces color-coded by data value to show discrete values through a 3D grid.
Isosurfaces display surfaces of constant data value. Specify the color and transparency for each surface to indicate its value. |
| Voxler Rendered Volumes | A rendered volume assigns a color and transparency value to every element in the 3D grid. Add a ClipPlane to display a slice through the volume at any angle.
A rendered volume displays a color for every element in the 3D grid. Add a ClipPlane to display a slice at any angle. |
| Voxler Contours | Contours display lines of constant data value along a plane. For a 3D grid, the plane can be oriented at any angle.
Add contours along a plane at any angle through a 3D grid. This example illustrates the contours intersecting a semi- transparent isosurface. |
| Voxler Height Fields | A height field displays data values as colors for a 2D grid, a 2D orthogonal slice of a uniform 3D grid, or along a 2D curvilinear lattice. The data magnitude is also depicted by the amount of displacement above or below the slice. The displacement is perpendicular to the plane or curvilinear lattice and is adjusted by the scale factor.
The height field displays data values from an orthogonal slice through a 3D grid. The height field opacity is set to be partially transparent to view the underlying contours the slice. |
| Voxler Stream Lines | Stream lines are used to display the path of particles through a velocity field, the distribution of velocities of a medium in 3D space. Different colors indicate the magnitude of the velocities.
Stream lines indicate particle paths through a vortex. Colors show the relative velocities of the particles, with purple being slower and red being faster. |
| Voxler Vector Planes | A vector plot displays lines or arrows indicating the direction and magnitude indicated by the components of a 3D grid or point data set. The magnitude of the vectors is shown by length and color.
Vector arrows indicate direction and magnitude of the three components parallel to the X, Y, and Z axes in a 3D grid. Magnitude is also shown by color with red being higher magnitude and purple showing lower magnitude. |
| Voxler Scatter Plots | A scatter plot displays symbols at the XYZ location specified in the data file. If the data file has a value at each data point, specify different colors for different data values.
A scatter plot displays symbols for the data sampled in boreholes. Different colors indicate different levels of concentration at each XYZ location. |
| Voxler Clip Planes | Add a clip plane to any graphic to remove the portion on one side of the clip plane. Add multiple clip planes at different angles to display the area of interest without obstruction.
Clip planes remove a portion of a graphic to display the sections hidden by the intervening parts of the object. Here, two clip planes allow the display of an irregularly shaped region. |
| Voxler Annotation and Text | Use annotation and text to add textual information to a plot. Annotation is used to display textual information positioned at the specified screen coordinates. Text is used to display textual information anchored at data XYZ coordinates.
This animation shows how text moves when the graphic is rotated. Annotation remains stationary on the screen. |
| Voxler Axes | Add axes to a plot to display the XYZ coordinate ranges. Axes are color-coded to identify each direction. Change the plane of the axis labels the axis and rotate the labels around a point centered at each tick mark.
Display axes on a plot to show the X, Y, and Z ranges. Change the axis colors and text angles to differentiate each direction. |
| Voxler Bounding Box | The bounding box is a part of a plot that shows the limits of the XYZ data ranges. It is a good way to show the ranges when the settings produce a graphic that does not cover the entire range, as for some isosurfaces. It also provides a good reference system to orient the graphic output.
The isosurface on the left is difficult to interpret without any reference points. The same isosurface on the right makes a lot more sense with the addition of a bounding box. |
| Voxler 3D Gridding | Voxler can take scattered XYZC data (XYZ coordinates with a data value C) and produce a uniform 3D grid using Inverse Distance, and Local Polynomial gridding methods. It also can calculate a large number of Data Metrics within the specified search radii, including minimum, maximum, median, mean, quartiles, standard deviation, variance, count, density, and distance to nearest and farthest point.
Voxler takes XYZC data (black) and calculates a uniform 3D grid (purple) to use for displaying isosurfaces, rendered volumes, and other graphics. with the addition of a bounding box. |
| More Computational Operations with Voxler | Voxler provides a number of computational options including filters for eliminating duplicate data points, removing data points based on the X, Y, Z, or data values, calculating normal, distance-weighted, Gaussian averaging, data metrics, and image processing. Other computational modules calculate gradient, grid math with up to three 3D grid files, merge up to five 3D grid files, resample, subset, and transform operations. |
| Adding Light to a Scene with Voxler | Lighting options include ambient light, camera headlight, directional, point, and spot lights with settings for color, intensity and direction. Use the graphical Dragger tool to aim and position directional, point, and spot lights.
Use the Dragger tool (shown in the upper portion of the illustration) to graphically position and angle a directional green light on the scene. |
| Printing with Voxler | Voxler features an improved print dialog with a print preview that is especially helpful when printing graphics that cover several pages. Don’t guess at how many pages a large plot will need! View the page requirements in the dialog preview. Print everything, or just the current view. Control image quality, add antialiasing to smooth a print out, and print the background color as needed.
Control your printed output with precision and ease. Preview the look of a large plot that spans several pages before you send the print job to the printer. |
| Voxler User Interface | Voxler implements a modern user interface with dockable and floating windows and toolbars. The Network window graphically displays the connections between data and output, and Properties window lists the settings specified for each module.
The Voxler user interface consists of windows and toolbars that are docked to the edge of the Voxler application window, or detached and floating. |
| Voxler Network Window | The Voxler Network window graphically displays the modules (input data, computational, graphic output, info) and their connections. “LED” lights display green, yellow, or red to indicate the status of the module. Click on a module to select it and to display its settings in the Properties window.
The Network window presents a graphical display of the input data, computational, graphic output, and info modules and the connections between the modules. |
| Voxler Properties Window | The Properties window lists the settings for the selected module with edit boxes, sliders, and buttons for changing the settings.
The Properties window displays a list of the settings for the selected module. Edit boxes, sliders, and buttons provide the methods for changing the settings. |
| Voxler Module Library | The Module Library shows a list of available modules and commands in an accessible format. The window is docked by default, and drag the title bar to float the window.
The Module Library lists the available modules. Double-click on a module to load it to the Network window. |
| Voxler Reposition Toolbars and Windows | Toolbars and windows are docked to the Voxler application window by default, or drag the title bar to a new location to float the windows in any position.
Detach the menu bar, toolbars, and windows to rearrange your workspace the way you want it. |
// Target Users //
- Geoscientists with 3D data from drill holes, petrography, seismic studies, and remote sensing surveys.
- Environmental Professionals with 3D data from groundwater and soil contaminant studies.
- Meteorologists with 3D data from atmospheric studies.
- Oceanologists with 3D data from ocean surveys of water temperature, salinity, and contaminants.
- Biologists with 3D data from organism sampling.
- Bio-technicians visualizing Confocal microscopy data.
- Medical Professionals with 3D data from MRI, CT, and ultrasound scans.
- Engineers with 3D data showing parameters distributed throughout the volume of an object.
- Engineers dealing with the visualization of computational fluid dynamics.
- Research and Development Groups performing numerical simulations.
- Geo-Statisticians needing to illustrate reservoir characterizations.
- Seismologists requiring velocity modeling.
- Anyone who wishes to see the distribution of 3D data.
// Official Demo Video //
// Universal License Keys //
| For | Username |
| v4.1.xxx+ |
|
// Edition Statement //
AppNee provides the Voxler multilingual full installers and all versions universal serial numbers for Windows 32-bit and 64-bit.
// Installation Notes //
for v4.1.xxx:
- Download and install Voxler (very slow)
- Run program, and use the universal serial number to register
- Done
// Related Links //
// Download URLs //
| Version | Download | Size |
| v4.6.913 Final |  |
88.1 MB |
(No Homepage)
| If some download link is missing, and you do need it, just please send an email (along with post link and missing link) to remind us to reupload the missing file for you. And, give us some time to respond. | |
| If there is a password for an archive, it should be "appnee.com". | |
| Most of the reserved downloads (including the 32-bit version) can be requested to reupload via email. |