Tag Archives: data visualization

[v2023.1, v10.2] Tableau Desktop – Business analytics that anyone can learn and use

This article along with all titles and tags are the original content of AppNee. All rights reserved. To repost or reproduce, you must add an explicit footnote along with the URL to this article!
Any manual or automated whole-website collecting/crawling behaviors are strictly prohibited.
Any resources shared on AppNee are limited to personal study and research only, any form of commercial behaviors are strictly prohibited. Otherwise, you may receive a variety of copyright complaints and have to deal with them by yourself.
Before using (especially downloading) any resources shared by AppNee, please first go to read our F.A.Q. page more or less. Otherwise, please bear all the consequences by yourself.
This work is licensed under a Creative Commons Attribution-NonCommercial-ShareAlike 4.0 International License.

Tableau Desktop is a famous and very powerful data analysis & visualization leader. In addition to professional technology, more importantly, it’s a foolproof tool that can make externalization and visualization process to complex data, so that ordinary users are able to easily show their complex data in hand in a professional way with all sorts of graphs.

Continue reading [v2023.1, v10.2] Tableau Desktop – Business analytics that anyone can learn and use
[v17.0, v14.1] Stata – Popular statistical software for data science

Stata is an integrated statistical software that integrates data analysis, data management and professional charts drawing features in one place. It is mainly used for data manipulation, visualization, statistics, and automated reporting by researchers in many fields, including biomedicine, economics, epidemiology, and sociology.

Continue reading [v17.0, v14.1] Stata – Popular statistical software for data science

If some download link is missing, and you do need it, just please send an email (along with post link and missing link) to remind us to reupload the missing file for you. And, give us some time to respond.
If there is a password for an archive, it should be "appnee.com".
Most of the reserved downloads (including the 32-bit version) can be requested to reupload via email.

[v10.4.15] MAXQDA – All-in-one qualitative & mixed methods data analysis tool

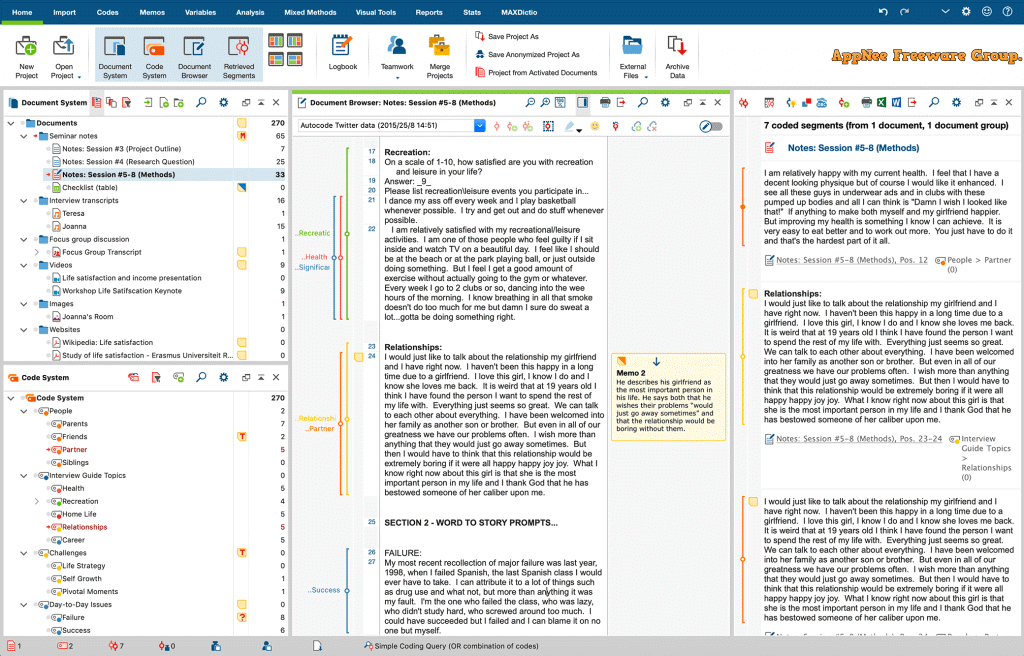
As a matter of fact, qualitative analysis is less dependent on software than numerical analysis. Although software brings great convenience, it can also hinder people’s thinking ability, even the actual effect is not as good as the traditional pen & paper operation. Anyway, there have been a lot of QDA (Qualitative Data Analysis) software in the market, but only three of them are the most popular ones: ATLAS.ti, NVivo and MAXQDA. By contrast, MAXQDA’s user interface is friendly, supports Unicode encoding, has a very small file size (only dozens of MBs), and runs fast.

Continue reading [v10.4.15] MAXQDA – All-in-one qualitative & mixed methods data analysis tool

[v14.0] SigmaPlot – Most advanced scientific graphing and statistical analysis platform

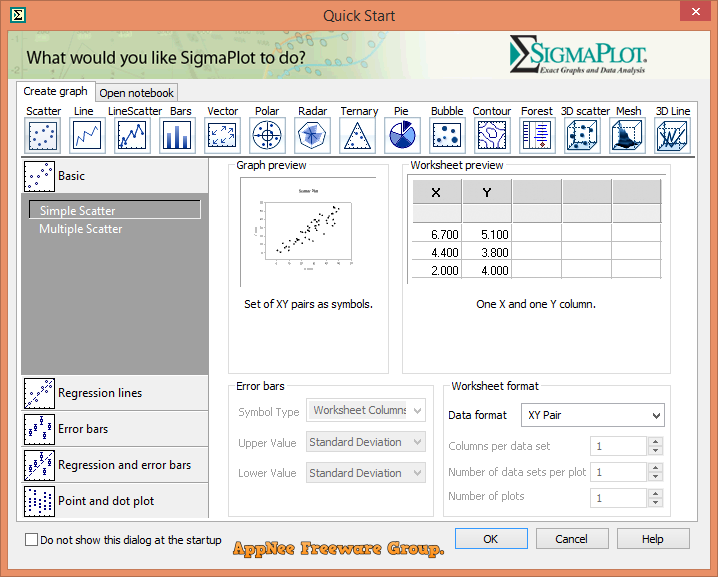
If you often publish technological articles and papers, and have lots of data to be converted to 2D (x, y axis) or 3D (x, y, z axis) of graphics, then SigmaPlot can save you a lot of time and expensive manual work. It can help users quickly and clearly draw accurate, high-quality 2D/3D charts. At the same time, it also comes with powerful data statistics and analysis capabilities that can serve in many fields

Continue reading [v14.0] SigmaPlot – Most advanced scientific graphing and statistical analysis platform